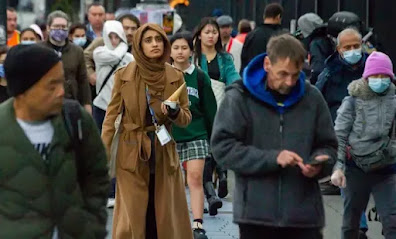
For the first time, a majority of Metro Vancouver residents now identify as a member of a racialized group, census data shows
New data from Statistics Canada released Wednesday provides a portrait of Canada’s immigrant population and ethnocultural and religious diversity.
It shows two urban centres in B.C. — Vancouver and Abbotsford-Mission — have among the highest proportion of immigrants, higher than the national average.
It also shows that the proportion of racialized people in the Metro Vancouver has surpassed 50 per cent for the first time.
Here are five things to know about the StatCan data for Metro Vancouver and B.C.:
42 per cent of Metro Vancouver’s population are immigrants
While immigrants make up nearly a quarter of all people in Canada, that figure is predictably higher in large metropolitan areas like Metro Vancouver.
According to the latest census, 1,089,185 people in the region identified as immigrants, representing nearly 42 per cent of the population.
That’s the second-highest proportion of immigrants in census metropolitan areas, second only to Toronto.
Abbotsford-Mission, at 26 per cent, also has a proportion of immigrants above the national average.
Across the province, 29 per cent of British Columbians identified as immigrants.
Statistics Canada also breaks down the proportion of immigrants by municipalities.
In B.C., Richmond tops the list, with about 60 per cent of residents identifying as immigrants. Burnaby comes second at 50 per cent, followed by Coquitlam at nearly 46 per cent.
(The census placed Electoral Area A as third, but that region comprises of areas including the University of British Columbia, the University Endowment Lands, Barnston Island, and lands along Howe Sound).
Recent immigration on the rise
Canada saw a record number of new immigrants arrive between 2016 and 2021 despite COVID-19 pandemic restrictions that curtailed numbers in 2020.
Over 1.3 million recent immigrants were permanently admitted into Canada from 2016 to 2021, accounting for nearly 16 per cent of all immigrants living in Canada in 2021, said Statistics Canada.
Metro Vancouver welcomed 154,815 new immigrants over the five-year 2021 census period, up about 8.6 per cent compared to 2016.
Despite the total increase, the percentage of newcomers coming to Metro Vancouver versus other parts of Canada remained steady at about 11.7 per cent.
Metro Vancouver has the third-highest percentage of recent immigrants after Toronto (29.5 per cent) and Quebec (12.2 per cent).
Visible minorities are now a majority — at least in Metro Vancouver
For the first time, the proportion of people of colour in Metro Vancouver has surpassed 50 per cent.
About 54 per cent of Metro Vancouver residents identify as a member of a racialized group, up from 48.9 per cent in the 2016 census.
Of these, more than one in three, or 36 per cent per cent, are made up of people of Chinese heritage. About 26 per cent are people of South Asian descent, and 10 per cent are of Filipino heritage.
In B.C., 1,689,490 out of about 4.9 million people, or 34 per cent, identify as a visible minority.
Richmond, Burnaby and Surrey are most diverse
Among municipalities, Richmond, Burnaby and Surrey have the highest percentage of people identifying as a racialized person in 2021 census data.
Richmond topped the list, with 80.3 per cent of residents belonging to a minority group. Burnaby is second with 67.8 per cent, followed closely by Surrey at 67.1 per cent.
B.C. is the most secular province in Canada
More than half, or 52 per cent, of British Columbians reported no religious affiliation in the 2021 census, considerably higher than the national figure of 34.6 per cent.
The only place more secular than B.C. is the Yukon, a territory where nearly 60 per cent reported they do not observe or practice a religion.
B.C. ranked second in the country with a large non-Christian population of 13.7 per cent.
Christians make up 34 per cent of British Columbians, followed by people who observe a Sikh religion — which at 5.9 per cent is the highest proportion in the country — Muslim (2.5 per cent), and Buddhists (1.7 per cent).
Nearly half of Metro residents aren’t religious
Number of people in Metro Vancouver reporting a religious affiliation in 2021.
Are you looking to buy or sell property? If you’d like, we can have a real estate expert show you the most efficient process that saves you thousands of dollars, a lot of time, with little or no inconvenience to you. Contact us today!


